File:Relative Volatility vs T&P.png: Difference between revisions
Jump to navigation
Jump to search
imported>Milton Beychok (uploaded a new version of "Image:Relative Volatility vs T&P.png": {{Image notes |Description= Diagram of the effect of temperature or pressure on relative volatility |Author= Milton Beychok |Date= April 8, 2009 |Source= I drew it myself |Country first published in= United States |Copyright holder= Milton Beychok |Notes= This is an updated version of the diagram I originally uploaded. |Other versions=}}) |
(== Summary == Importing file) Tag: Server-side upload |
||
| (3 intermediate revisions by 2 users not shown) | |||
| Line 1: | Line 1: | ||
== Summary == | == Summary == | ||
Importing file | |||
Latest revision as of 19:52, 11 March 2022
Summary
Importing file
File history
Click on a date/time to view the file as it appeared at that time.
| Date/Time | Thumbnail | Dimensions | User | Comment | |
|---|---|---|---|---|---|
| current | 19:52, 11 March 2022 | 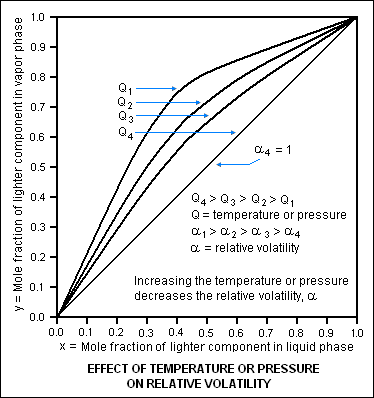 | 374 × 398 (14 KB) | Maintenance script (talk | contribs) | == Summary == Importing file |
You cannot overwrite this file.
File usage
The following 3 pages use this file: