File:Longevity disparities.JPG: Difference between revisions
Jump to navigation
Jump to search
imported>Anthony.Sebastian ({{Image notes |Description= Research showing growing disparities in life expectancy for richer and poorer Americans, 1980-2000 |Author= Chart from Singh and Siahpush’s report by the New York Times, March 23, 2008. |Date= 2008 |Source= Data from U.S. Department of Health and Human Services, synthesized by <ref singh2006>Singh GK, Siahpush M. (2006) [http://dx.doi.org/10.1093/ije/dyl083 Widening socioeconomic inequalities in US life expectancy, 1980–2000. (Free Full-Text)] Int. J. Epidemiol. A...) |
imported>Caesar Schinas m (Bot: Replace Template:Image_notes_* with Template:Image_Details) |
||
| Line 1: | Line 1: | ||
== Summary == | == Summary == | ||
{{ | {{Image_Details | ||
| | |description = Research showing growing disparities in life expectancy for richer and poorer Americans, 1980-2000 | ||
| | |author = Chart from Singh and Siahpush’s report by the New York Times, March 23, 2008. | ||
| | |copyright = | ||
| | |source = Data from U.S. Department of Health and Human Services, synthesized by <ref singh2006>Singh GK, Siahpush M. (2006) [http://dx.doi.org/10.1093/ije/dyl083 Widening socioeconomic inequalities in US life expectancy, 1980–2000. (Free Full-Text)] Int. J. Epidemiol. Advance Access Publication.</ref> | ||
| | |date-created = 2008 | ||
| | |pub-country = U.S. | ||
|notes = Claim fair use, since NY Times used government data to make chart. | |||
| | |versions = | ||
}} | |||
== Licensing/Copyright status == | == Licensing/Copyright status == | ||
{{Test-template}} | {{Test-template}} | ||
Revision as of 04:25, 22 June 2009
Summary
| Title / Description
|
Research showing growing disparities in life expectancy for richer and poorer Americans, 1980-2000 |
|---|---|
| Author(s)
|
Chart from Singh and Siahpush’s report by the New York Times, March 23, 2008. |
| Copyright holder
|
Please edit this page and add the name of the copyright holder, or note why this is not applicable. |
| Source
|
Data from U.S. Department of Health and Human Services, synthesized by Cite error: Invalid <ref> tag; invalid names, e.g. too many
|
| Date created
|
2008 |
| Country of first publication
|
U.S. |
| Notes
|
Claim fair use, since NY Times used government data to make chart. |
| Other versions
|
If there are other versions of this media on CZ, please list them here. |
| Using this image on CZ
|
Copy the code below to add this image to a Citizendium article, changing the size, alignment, and caption as necessary.
|
Image issue? Contact us via the email below.
Please send email to manager A T citizendium.org .
Licensing/Copyright status
File history
Click on a date/time to view the file as it appeared at that time.
| Date/Time | Thumbnail | Dimensions | User | Comment | |
|---|---|---|---|---|---|
| current | 19:55, 11 March 2022 | 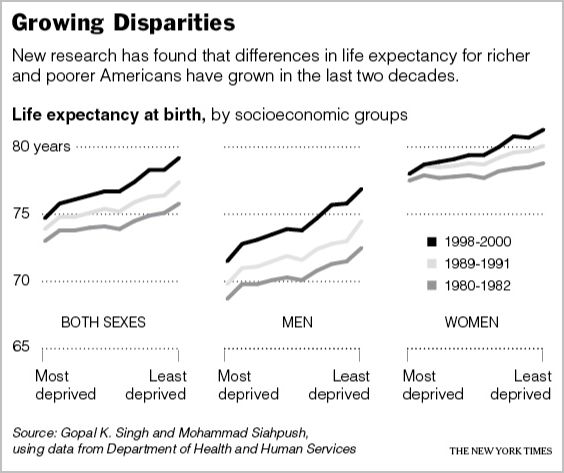 | 564 × 473 (53 KB) | Maintenance script (talk | contribs) | == Summary == Importing file |
You cannot overwrite this file.
File usage
The following 2 pages use this file: