Supply and demand/Tutorials: Difference between revisions
Jump to navigation
Jump to search

imported>Nick Gardner mNo edit summary |
imported>Nick Gardner No edit summary |
||
| Line 6: | Line 6: | ||
==Graphical representations of supply and demand== | ==Graphical representations of supply and demand== | ||
===The shape of the demand curve=== | ===The shape of the demand curve=== | ||
- | The converse of the premise stated in the article is that the less of a thing that a person possesses, the more he is prepared to pay to acquire a little more of it. That means that a progressively larger price increase is needed to produce a given reduction in demand. Thus the slope of the price/demand curve increases as price is increased and falls as price is reduced - leading to a curve that is concave when viewed from above. | ||
- | - | ||
Revision as of 09:11, 26 April 2008
(Introduction to be added)
Graphical representations of supply and demand
The shape of the demand curve
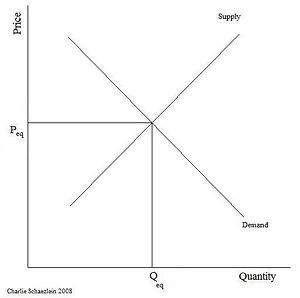
The converse of the premise stated in the article is that the less of a thing that a person possesses, the more he is prepared to pay to acquire a little more of it. That means that a progressively larger price increase is needed to produce a given reduction in demand. Thus the slope of the price/demand curve increases as price is increased and falls as price is reduced - leading to a curve that is concave when viewed from above.
-
The basic diagram
-
-
-
-
-
-
-
-
-
-
-
Consumers surplus and the effect of tax
-
-
-
-
-
-
-
-
-
-
-
-
-

