CZ:Cold Storage/Energy conversion
This article addresses analysis of energy conversion as it pertains to power cycles (Carnot, Brayton, Otto and Diesel), power cycle components/processes (compression, combustion and expansion) and compressible flow (nozzle, diffuser and thrust) ideal operation, T-s diagrams and performance trends.
Power cycle analysis
In this section dealing power cycles, ideal and isentropic operation of Carnot, Brayton, Otto and Diesel cycles and their preformance trends are presented.
Carnot cycle
In the presented Carnot cycle analysis, only air is considered as the working fluid and behaving as a perfect gas. Specific heat has a constant value. Ideal gas state equation is valid, that is pv = RT.
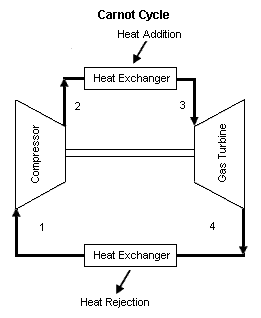
Figure 1 contains a Carnot cycle schematic diagram. Air enters a compressor at point 1, and exits the compressor at point 2. Isentropic compression is considered with no entropy change. Air enters a heat exchanger -- heat addition -- at point 2, and exits the heat exchanger at point 3. At a constant temperature, heat addition takes place. Air enters a turbine at point 3, and exits the turbine at point 4. Isentropic expansion is considered with no entropy change. Air enters a heat exchanger -- heat rejection -- at point 4, and exits the heat exchanger at point 1. At a constant temperature, heat rejection takes place. It should be mentioned that air at point 1 enters the compressor and the cycle is repeated.
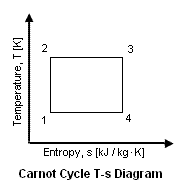
Figure 2 presents a temperature versus entropy of the Carnot cycle. The thermal efficiency of the cycle can be expressed as a function of the specific external work (i.e., specific net power output) and the added heat to the working fluid as follows:
and
η is thermal efficiency, w is specific external work (i.e., specific net power output) [kJ/kg], wt is expansion specific power output [kJ/kg], wcis compression specific power input [kJ/kg], qh is heat added to the working fluid [kJ/kg], ql is heat rejected from the working fluid [kJ/kg], Δs is entropy change during heat addition and heat rejection, TA is temperature during heat addition, TR is temperature during heat rejection, T1 is compressor inlet temperature, T2 is compressor outlet temperature, T3 is turbine inlet temperature and T4 is turbine outlet temperature.
For the isentropic compressor and turbine:
and is 1.4 for air
and
Again, it follows that:
Thus, we see that the Carnot cycle efficiency is not dependant on the working fluid properties. It is dependent only on the inlet and outlet temperatures.
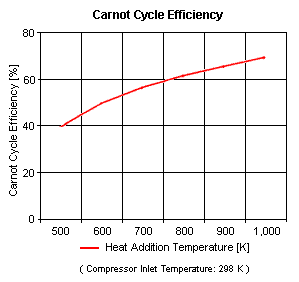
Figure 3 presents the Carnot cycle efficiency as a function of the heat addition temperature (with the compressor inlet temperature at ambient conditions of 298 K and 1 atm of absolute pressure).
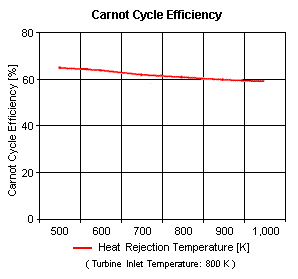
Figure 4 presents the Carnot cycle efficiency as a function of the heat rejection temperature (with the turbine inlet temperature at 800 K.
It can be shown that the Carnot cycle efficiency increases with an increase in the heat addition temperature when the heat rejection temperature is constant, and the cycle efficiency decreases with an increase in the heat rejection temperature when the heat addition temperature is constant. To do so, the general assumptions are:
- The working fluid is air, there is no friction, the compression and expansion are isentropic, the air temperature does not change during the heat addition and heat rejection, the air behaves as an ideal gas (i.e., pv = RT) and the specific heat is constant.
The governing equations are:
The input data are: T1 = 298 K, p1 = 1 atm and k is 1.4 for air. The results are shown in Tables 1 and 2:
| Heat Addition Temperature, K |
Cycle Efficiency, % |
|---|---|
| Heat Rejection Temperature, K |
Cycle Efficiency, % |
|---|---|


